Marketxls Features! Investing in the stock market requires precise tools and reliable data. MarketXLS offers just that.
This Excel-based software is designed to help investors research, track, and make informed decisions. MarketXLS provides a comprehensive solution for stock market analysis. Real-time data updates, advanced security, and a wide range of financial instruments make it indispensable. Whether you’re an individual investor or a financial analyst, MarketXLS has features tailored to your needs. From technical indicators to pre-made templates, it streamlines your workflow. Dive into the powerful features of MarketXLS and see how it can enhance your investment strategy. To learn more, visit the MarketXLS website.
Introduction To Marketxls
MarketXLS is a robust tool designed for investors and traders. It integrates seamlessly with Excel to provide real-time financial data, technical analysis, and stock screening capabilities. This software empowers users to make informed investment decisions quickly and efficiently.
What Is Marketxls?
MarketXLS is an Excel-based software that helps users research, track, and invest in the stock market. It provides access to real-time stock data and includes powerful tools for financial analysis. Users can monitor over 13,574 stocks, 3,119 ETFs, 26,802 mutual funds, millions of options, 9,600 crypto symbols, and 300+ economic datasets.
Purpose And Importance In Financial Analysis
The primary purpose of MarketXLS is to enhance investment research and decision-making. It offers real-time updates, historical data, and technical indicators directly within Excel. This integration allows users to create customized financial models and insights, leading to better investment strategies.
MarketXLS is essential for various financial professionals:
- Investment Managers
- Registered Investment Advisors (RIAs)
- Asset Managers
- Financial Analysts
- Individual Investors
Some of the key benefits include:
- Real-time Data: Keeps your models and portfolio status updated with advanced security.
- Wide Data Coverage: Provides comprehensive data across multiple financial instruments and markets.
- Technical Analysis: Offers over 100 technical indicators, including Bollinger bands, Moving averages, stochastics, and MACD.
- Google Sheets Integration: Allows live prices and data on Google Sheets for broader accessibility.
- Utilities and Templates: Includes pre-made stock lists, symbol lookups, industry classifications, and valuation models.
MarketXLS also provides strong customer support, with less than 12 hours of response time and a community of over 5,000 customers. This ensures users can get help and stay connected with a supportive network.
Credit: marketxls.com
Data Integration And Accessibility
MarketXLS excels in providing comprehensive data integration and accessibility for stock market investors. This powerful Excel-based software enhances research capabilities and decision-making processes. Users benefit from real-time data updates and seamless integration of various data sources.
Seamless Data Import From Various Sources
MarketXLS allows users to import data from multiple sources. The software supports over 13,574 stocks, 3,119 ETFs, and 26,802 mutual funds. Additionally, users can access millions of options, 9,600 crypto symbols, and 300+ economic datasets. This extensive data coverage ensures that investors have all the information they need.
| Data source details | s |
|---|---|
| Stocks | 13,574 stocks |
| ETFs | 3,119 ETFs |
| Mutual Funds | 26,802 mutual funds |
| Options | Millions of options |
| Crypto Symbols | 9,600 crypto symbols |
| Economic Datasets | 300+ economic datasets |
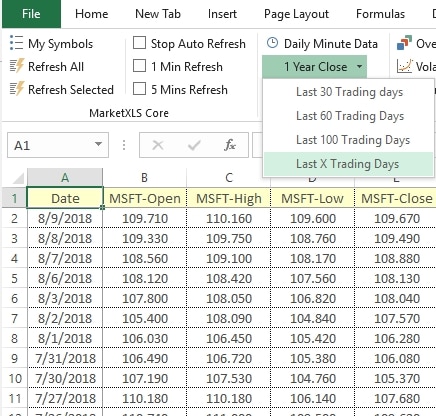
Real-time Data Updates
MarketXLS ensures real-time updates for models, insights, and portfolio status. Investors can make informed decisions based on the most current data. The software’s real-time data streaming includes live quotes and historical data. Users also get real-time stock options prices.
Moreover, MarketXLS integrates with Google Sheets for live prices and data, enhancing data accessibility. This feature is handy for users who prefer working on Google Sheets.
With advanced security measures, MarketXLS keeps your data safe while providing up-to-date information. Real-time data updates are crucial for making timely investment decisions and tracking market movements effectively.
MarketXLS offers a robust solution for stock market data integration and accessibility. Its seamless data import capabilities and real-time updates make it a valuable tool for investors seeking to optimize their research and investment strategies.
Advanced Analytical Tools
MarketXLS offers a suite of advanced analytical tools designed to help investors make better decisions. These tools bring real-time data, technical analysis, and customizable financial models directly into Excel. This makes MarketXLS a powerful ally for anyone looking to invest in the stock market. Let’s explore some of the key features under this category.
Customizable Financial Models
MarketXLS allows users to create and customize financial models to fit their specific investment needs. With access to real-time data and over 13,574 stocks, 3,119 ETFs, and more, you can build models that reflect current market conditions. Here are some features:
- Real-time Data Integration: Update your models with the latest stock prices and market information.
- Pre-made Templates: Use pre-built templates for faster setup and analysis.
- Wide Data Coverage: Incorporate data from a vast array of financial instruments.
Whether you are an individual investor or a financial analyst, these customizable models can help you streamline your workflows and make informed decisions.
Comprehensive Technical Indicators
Technical analysis is crucial for understanding market trends and making strategic investment decisions. MarketXLS offers over 100 technical indicators, including:
| Indicator | Description |
|---|---|
| Bollinger Bands | Measures market volatility and price levels over time. |
| Moving Averages | Calculates the average price over a specific period. |
| Stochastics | Helps identify overbought or oversold conditions. |
| MACD | Shows the relationship between two moving averages of prices. |
These indicators are easily accessible within Excel, allowing you to analyze historical data and real-time quotes. They help in making data-driven decisions and predicting future market movements.
MarketXLS’s advanced analytical tools are designed to enhance your investment research and decision-making process. With customizable financial models and comprehensive technical indicators, you can stay ahead of the market trends and optimize your investment strategy.
Credit: marketxls.com
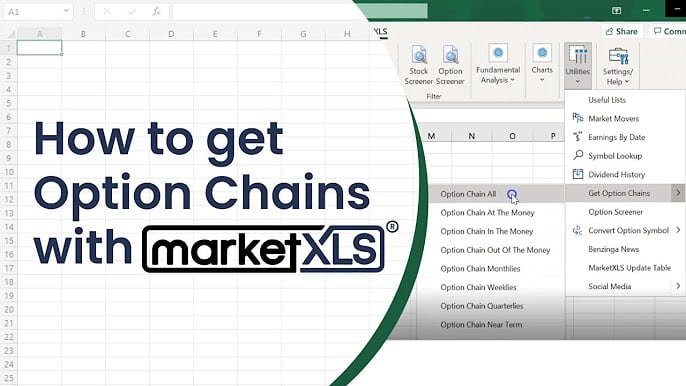
Stock And Options Analysis
MarketXLS offers a comprehensive suite of tools for stock and options analysis. This Excel-based software helps investors make informed decisions with real-time data and advanced analysis features. Let’s explore some of the key functionalities that make MarketXLS a valuable asset for stock and options traders.
Detailed Stock Screener
MarketXLS’s detailed stock screener allows users to filter stocks based on various criteria. This feature is essential for identifying potential investment opportunities quickly.
- Over 13,574 stocks to choose from.
- Filter by market capitalization, P/E ratio, and other financial metrics.
- Customize your screener to match your investment strategy.
With the real-time data integration, the stock screener updates instantly, providing the most current information available.
Options Pricing And Analysis Tools
Options traders will find MarketXLS’s options pricing and analysis tools invaluable. These tools help in evaluating and strategizing options trades with precision.
- Real-time options pricing for accurate decision-making.
- Access to millions of options contracts.
- Comprehensive analysis tools like the Black-Scholes model.
These tools ensure you have all the necessary data to execute options trades effectively.
MarketXLS provides data and equips you with the tools to analyze and act on that data, making it an indispensable tool for stock and options traders.
Portfolio Management Features
Managing a diverse investment portfolio is challenging. MarketXLS offers robust portfolio management features to simplify this task. These features help investors analyze, track, and optimize their investments effectively.
Tracking And Performance Metrics
Keeping track of investments is crucial for success. MarketXLS provides real-time updates on portfolio status. These updates help you monitor stock performance accurately.
Investors can use over 100 technical indicators, including Bollinger bands, Moving averages, stochastics, and MACD, to analyze stocks. Access to live and historical data enhances this analysis. The platform supports over 13,574 stocks, 3,119 ETFs, and 26,802 mutual funds.
For those who prefer Google Sheets, MarketXLS offers a plugin for live prices and data. This feature ensures flexibility in managing and tracking portfolios.
Risk Assessment And Management
Assessing risk is essential for any investor. MarketXLS provides tools to evaluate and manage risks effectively. The platform offers detailed insights into stock volatility and other risk factors.
Use pre-made stock lists and valuation models to assess potential investments. These tools help you make informed decisions. Additionally, the platform covers millions of options, 9,600 crypto symbols, and 300+ economic datasets. This vast data coverage ensures comprehensive risk assessment.
Investors can also access global data bundles for futures, European stocks, and international markets. This global coverage helps in diversifying and managing investment risks.
With MarketXLS, investors benefit from enhanced security and optimized data streaming. These features ensure that your investment data is protected and up-to-date.
| Feature | Details |
|---|---|
| Real-time Data | Real-time updates with advanced security |
| Technical Indicators | Over 100 indicators including Bollinger bands, Moving averages, stochastics, MACD |
| Data Coverage | Over 13,574 stocks, 3,119 ETFs, 26,802 mutual funds, millions of options |
| Google Sheets Integration | Live prices and data plugin |
| Global Coverage | Futures, European stocks, and international markets |
By leveraging these portfolio management features, investors can enhance their research, make better decisions, and potentially increase profits.
Credit: marketxls.com
Pricing And Affordability
Understanding the pricing structure is crucial for any investment in software. MarketXLS offers competitive pricing, ensuring it caters to various needs and budgets. Here’s a detailed look at their pricing and affordability.
Subscription Plans And Costs
MarketXLS provides several subscription plans to accommodate different user requirements. Here’s a breakdown:
| Plan | Monthly Cost | Annual Cost | Features |
|---|---|---|---|
| Basic | $19.95 | $199.50 | Real-time data, basic support |
| Pro | $39.95 | $399.50 | Advanced analytics, premium support |
| Premium | $69.95 | $699.50 | All features, dedicated support |
Value For Money Analysis
Evaluating the value for money provided by MarketXLS is essential. Here are some key points:
- Real-time Data: Stay updated with the latest market changes.
- Wide Data Coverage: Access to over 13,574 stocks and more.
- Technical Analysis: Over 100 indicators for informed decisions.
- Support: Less than 12 hours response time ensures quick help.
Considering the comprehensive features and robust support, MarketXLS offers substantial value. Whether you are a financial analyst or an individual investor, the investment in MarketXLS can lead to better decision-making and potentially higher returns.
Pros And Cons Of Marketxls
MarketXLS is a powerful Excel-based tool for stock market research and investment. It offers many features to help investors make informed decisions. While MarketXLS has many advantages, it also has some drawbacks. Let’s explore the pros and cons based on user feedback.
Advantages Based On User Feedback
Users have highlighted several benefits of using MarketXLS:
- Real-time Data: Provides real-time updates to models, insights, and portfolio status with advanced security.
- Wide Data Coverage: Access to over 13,574 stocks, 3,119 ETFs, 26,802 mutual funds, millions of options, 9,600 crypto symbols, and 300+ economic datasets.
- Technical Analysis: Includes over 100 technical indicators like Bollinger bands, Moving averages, stochastics, MACD, etc.
- Integration: Google Sheets plugin for live prices and data.
- Utilities and Templates: Pre-made stock lists, symbol lookup, industry and sector classifications, valuation models, and more.
- Global Coverage: Additional data bundles for futures, European stocks, and international markets.
- Support: Fanatical personal service with less than 12 hours response time and a community of over 5,000 customers.
Potential Drawbacks And Limitations
Despite its many advantages, MarketXLS has some limitations:
- Datafeed: MarketXLS does not provide its own datafeed or API access for commercial purposes.
- Usage Restrictions: The software is for personal use only, as defined in the License Agreement.
- Refund Policies: Refund policies are subject to the terms stated in the company’s Refund Policy.
- Price: Additional data bundles are available for purchase, which may increase the overall cost.
Ideal Users And Scenarios
MarketXLS offers a variety of features that cater to different types of users and scenarios. This section will help you understand who can benefit the most from MarketXLS and the best use cases for this powerful Excel-based stock market tool.
Who Can Benefit The Most?
MarketXLS is designed for a range of users, including:
- Investment Managers: Professionals managing multiple portfolios can use real-time data and technical analysis tools.
- Registered Investment Advisors (RIAs): RIAs can leverage the comprehensive data coverage and analysis tools for client portfolios.
- Asset Managers: Those responsible for large asset pools will find the live and historical data integration invaluable.
- Financial Analysts: Analysts can utilize the wide range of technical indicators and customizable templates.
- Individual Investors: MarketXLS provides tools for personal investment strategies and tracking.
Best Use Cases And Applications
MarketXLS shines in various scenarios, including:
- Real-time Portfolio Management: Keep track of portfolio status with real-time updates and advanced security features.
- Technical Analysis: Use over 100 technical indicators like Bollinger Bands and MACD for market analysis.
- Stock Screening: Screen for stocks using customizable filters and pre-made lists.
- Historical Data Analysis: Analyze historical stock data to spot trends and make informed decisions.
- Global Market Tracking: Access data for international markets, including European stocks and futures.
MarketXLS integrates seamlessly with Excel, providing a user-friendly interface for all these applications. Whether you are managing a large portfolio or researching stocks for personal investment, MarketXLS has the tools you need.
Frequently Asked Questions
What Is Marketxls?
Marketxls is a software that integrates with Excel to provide financial data and analysis tools.
How Does Marketxls Help Investors?
Marketxls helps investors by providing real-time stock data, historical prices, and financial analysis tools directly in Excel.
Can Marketxls Be Used For Stock Screening?
Yes, Marketxls offers stock screening features to help you find investment opportunities based on your criteria.
Does Marketxls Offer Technical Analysis Tools?
Yes, Marketxls provides various technical analysis tools, including indicators and charting options, for better decision making.
Is Marketxls Suitable For Beginners?
Yes, Marketxls is user-friendly and offers tutorials and support to help beginners use its features effectively.
What Data Sources Does Marketxls Use?
Marketxls uses reliable data sources like Yahoo Finance, Quandl, and others to provide accurate financial information.
Conclusion
MarketXLS offers a robust Excel-based solution for investors. The platform provides real-time data updates, making research and decision-making faster. It covers a wide range of stocks, ETFs, mutual funds, and more. Its tools and templates simplify investment tasks. The software also integrates with Google Sheets for added flexibility. Strong customer support ensures users get the help they need quickly. Discover how MarketXLS can enhance your stock market activities by visiting MarketXLS.