
Data-driven decision making is crucial in today’s business world. Business Intelligence (BI) tools help make sense of complex data.
In a world overflowing with data, making informed decisions is vital. Business Intelligence tools transform raw data into actionable insights. These tools help businesses understand trends, uncover patterns, and make strategic decisions. With so many options available, choosing the right BI tool can be overwhelming.
This blog post will explore the top Business Intelligence tools. We’ll highlight their key features and benefits to guide your decision-making process. Whether you’re a small business owner or a corporate executive, finding the right BI tool can improve your operations. Let’s dive into the best picks for data-driven decision making.
Introduction To Business Intelligence Tools
In today’s fast-paced business world, making informed decisions is crucial. Business Intelligence (BI) tools help companies analyze data and turn it into actionable insights. These tools are essential for any organization aiming to stay competitive and thrive in a data-driven environment.
Importance In Modern Business
BI tools are no longer a luxury; they are a necessity. They allow you to see trends, patterns, and anomalies in your data. This visibility helps you make decisions based on facts, not guesswork.
Imagine being able to predict customer behavior or optimize your supply chain. BI tools make these scenarios possible. They provide real-time data, enabling you to react swiftly to market changes.
Without BI tools, you’re flying blind. You’re relying on outdated reports or gut feelings. BI tools give you the confidence to make decisions that drive growth and efficiency.
Key Features
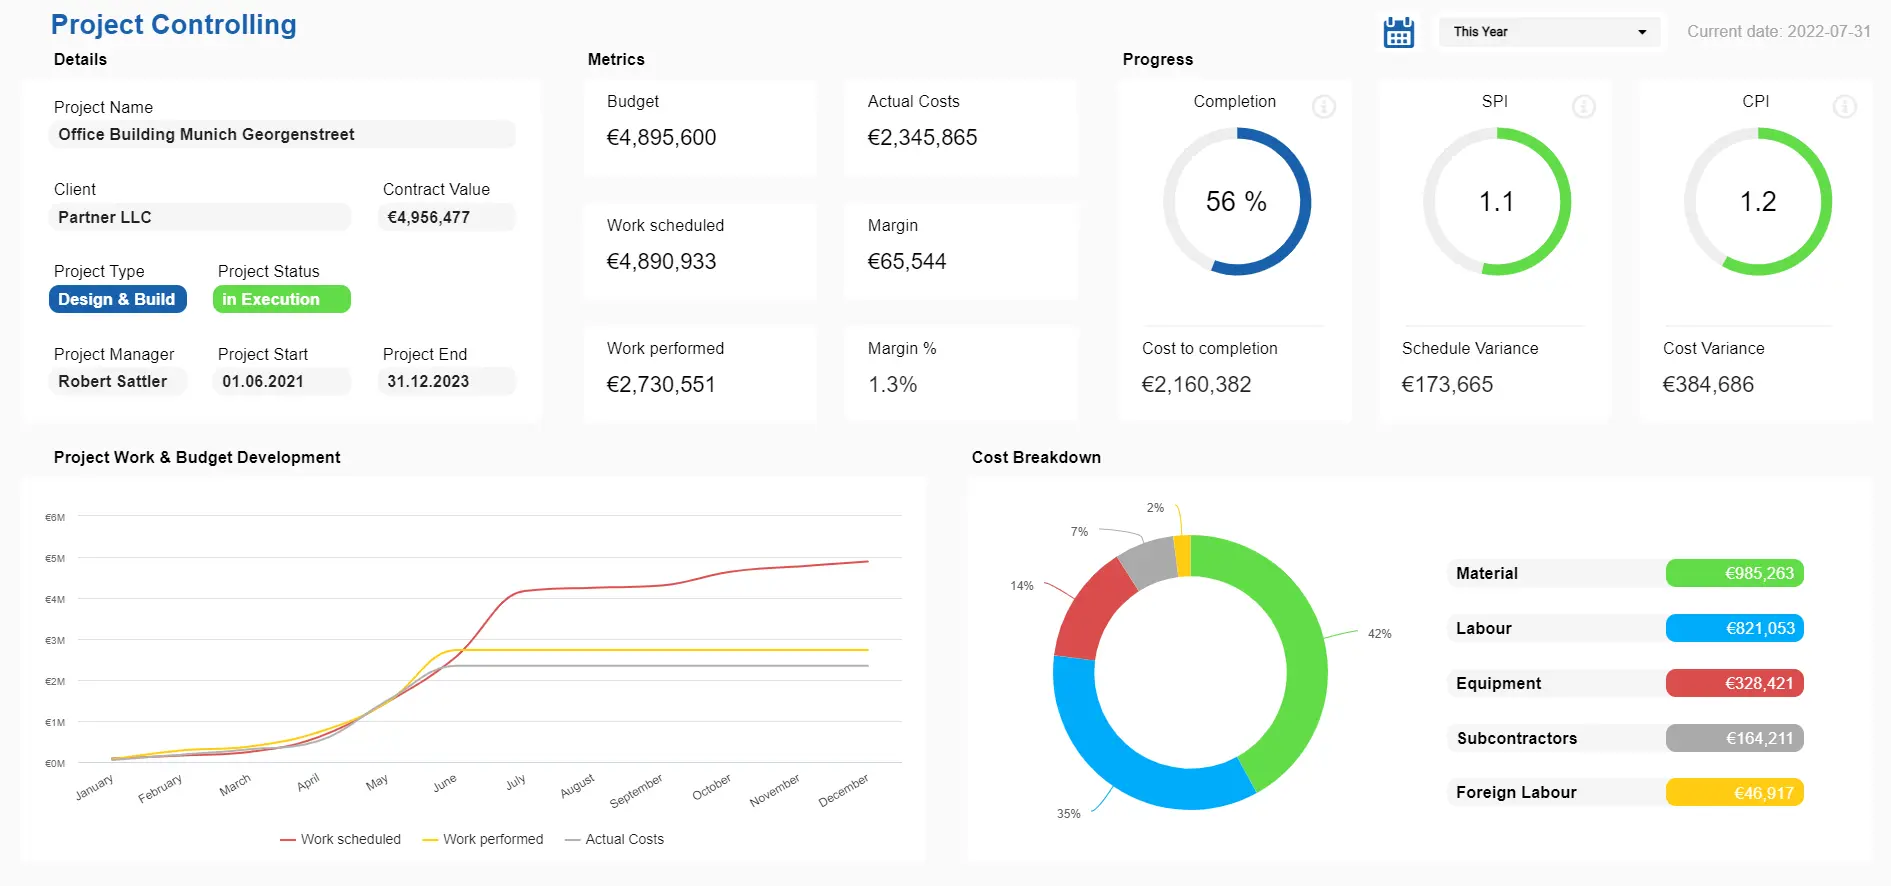
What sets BI tools apart are their powerful features. One key feature is data visualization. This allows you to see complex data in a simple, visual format like charts or graphs.
Another essential feature is real-time analytics. With this, you get up-to-the-minute data, ensuring your decisions are based on the latest information. This is crucial for fast-paced industries where yesterday’s data is already outdated.
Lastly, user-friendliness is a must. The best BI tools are easy to use, even if you’re not a data expert. They come with intuitive dashboards and customizable reports, making data analysis accessible to everyone in your organization.
Have you ever struggled with making sense of your data? BI tools could be the solution you need. By harnessing their power, you can transform your data into a strategic asset.
Credit: www.rib-software.com
Microsoft Power Bi
In the realm of data-driven decision making, Microsoft Power BI stands out as a top choice for businesses. It’s widely recognized for its ability to transform raw data into actionable insights. Let’s dive into what makes Microsoft Power BI an exceptional tool.
Overview And Benefits
Microsoft Power BI is a business analytics tool that enables you to visualize your data and share insights across your organization. It connects to multiple data sources, providing a unified view of your business data.
One of its major benefits is its user-friendly interface. Even if you’re not a tech expert, you can easily create reports and dashboards. This ease of use can significantly enhance productivity.
Moreover, Power BI offers real-time data access. Imagine having the ability to make decisions based on the latest data, no more waiting for overnight updates. This feature can give your business a competitive edge.
Pricing And Availability
Microsoft Power BI offers flexible pricing options to fit various business needs. There’s a free version available, which is great for small businesses or those just starting out with data analytics.
For larger organizations, the Pro version is priced at $9.99 per user per month. This version provides additional features like collaboration and data sharing.
There’s also the Premium version, starting at $20 per user per month. This option is ideal for enterprises needing advanced capabilities and dedicated cloud resources.
Have you ever wondered how much easier your decision-making process could be with real-time data at your fingertips? Microsoft Power BI might be the tool you’ve been looking for.
Tableau
If you’re looking to make data-driven decisions, Tableau is a powerful business intelligence tool to consider. It stands out for its user-friendly interface and robust visualization capabilities. But is it the right fit for your needs? Let’s dive into its strengths and weaknesses, as well as its integration capabilities.
Strengths And Weaknesses
Tableau excels in turning raw data into comprehensive visual insights. The drag-and-drop feature makes it easy for anyone, even those without technical skills, to create stunning dashboards. It’s particularly strong in handling large datasets without compromising performance.
However, Tableau has its downsides too. The cost can be a hurdle for small businesses. Additionally, while it offers many features, mastering them can take time. The complexity might require you to invest in training.
Integration Capabilities
Tableau shines in integration capabilities. It connects seamlessly with multiple data sources like SQL databases, cloud services, and even Excel. This flexibility means you can pull data from various platforms into a single dashboard.
But, how easy is it to integrate Tableau with your existing systems? The process is generally straightforward, but some users find the initial setup challenging. It might be helpful to consult with an expert during the integration phase.
So, is Tableau right for your business? Consider your budget, the complexity of your data, and how much time you can invest in learning the tool. What other features are you looking for in a BI tool? Your answers will guide you in making an informed decision.
Qlik Sense
In today’s data-driven world, making informed business decisions is crucial. One tool that stands out in the realm of Business Intelligence is Qlik Sense. It’s known for its user-friendly interface and powerful analytics capabilities, making it a top pick for companies looking to leverage their data effectively.
Unique Selling Points
Qlik Sense offers a unique combination of simplicity and power. One of its standout features is the associative data model, which allows you to explore data from multiple angles without predefined hierarchies. This means you can discover insights that might be hidden in traditional linear data models.
Another key selling point is its self-service capabilities. You don’t need to be a data scientist to use Qlik Sense. It’s designed for anyone in your organization to create visualizations and dashboards with ease. This democratizes data access, empowering more team members to make data-driven decisions.
Lastly, Qlik Sense excels in scalability. Whether you’re a small business or a large enterprise, it can handle vast amounts of data without compromising on performance. This ensures that as your business grows, your BI tool can grow with you.
Use Cases
Qlik Sense is versatile and can be applied across various industries. For instance, in retail, it can help you analyze customer purchase patterns and optimize inventory management. Imagine being able to predict which products will be in high demand during the holiday season; Qlik Sense makes this possible.
In healthcare, Qlik Sense can be used to track patient outcomes and improve care quality. By analyzing treatment data and patient histories, healthcare providers can make more accurate diagnoses and treatment plans.
Finance departments benefit greatly from Qlik Sense by monitoring cash flow, forecasting budgets, and identifying cost-saving opportunities. Picture yourself pinpointing where unnecessary expenses are occurring and reallocating resources to more profitable areas; Qlik Sense helps you achieve this with its robust analytics.
Have you ever wondered how a tool like Qlik Sense could transform your business decisions? Its unique features and wide array of use cases make it an indispensable asset for any data-driven organization.
Sap Businessobjects
When it comes to data-driven decision making, SAP BusinessObjects is a powerful tool that can help businesses make sense of their data. This tool offers a robust set of functionalities that make it easier to gather, analyze, and visualize data. Whether you are in retail, healthcare, or manufacturing, SAP BusinessObjects can provide the insights you need to make informed decisions.
Core Functionalities
SAP BusinessObjects is packed with core functionalities that make data analysis straightforward and efficient. One of the key features is its ability to integrate with various data sources. This means you can pull data from multiple systems and get a unified view.
The tool also offers a wide range of reporting options. You can create detailed reports that provide valuable insights into your business operations. Additionally, the drag-and-drop interface makes it easy to build custom reports without needing extensive technical skills.
Another standout feature is the data visualization capabilities. You can create interactive dashboards that help you see trends and patterns at a glance. This makes it easier to identify areas that need attention and take immediate action.
Industries Served
SAP BusinessObjects is versatile and serves a wide range of industries. In the retail sector, businesses use it to track sales performance, manage inventory, and understand customer behavior. This helps retailers optimize their operations and improve customer satisfaction.
Healthcare providers leverage SAP BusinessObjects to manage patient data, monitor treatment outcomes, and ensure compliance with regulations. This leads to improved patient care and operational efficiency.
Manufacturing companies use the tool to monitor production processes, manage supply chains, and ensure product quality. This helps them reduce costs and increase productivity.
Are you in one of these industries? How do you currently handle your data? Consider exploring SAP BusinessObjects to transform your decision-making process and gain a competitive edge.
Looker
When it comes to business intelligence (BI) tools, Looker stands out as a powerful option for data-driven decision-making. Looker allows you to visualize your data in a way that makes sense for your business. It’s user-friendly and offers a variety of features that can help you get the insights you need quickly and accurately.
Customization Options
One of the most impressive features of Looker is its customization options. You can tailor dashboards and reports to fit the specific needs of your business. This is incredibly useful if you have unique data points or metrics that standard BI tools don’t address.
For instance, in my previous job, we used Looker to create a custom dashboard that tracked real-time sales data. This allowed us to react quickly to any changes in our sales trends. You can do the same with your data, ensuring that you get the most relevant insights.
Customer Support
Another big plus for Looker is its customer support. It’s not just about having a tool; it’s about having the support you need to use it effectively. Looker’s customer support team is known for being responsive and helpful.
When we first started using Looker, we had a few issues setting up our initial dashboards. The customer support team was quick to respond and walked us through the process step-by-step. This level of support can make a huge difference, especially when you’re just getting started.
Have you ever struggled with setting up a new tool? Imagine having a team ready to assist you at every step. That’s what you get with Looker.
So, how important is customization and support to you? Are these features that you value in a BI tool? If the answer is yes, Looker might just be the perfect fit for your business needs.
Domo
When it comes to Business Intelligence tools, Domo stands out as an all-in-one solution that empowers organizations to make data-driven decisions. It offers a variety of features that help businesses analyze data in real time, collaborate seamlessly, and drive actionable insights. In this section, we will explore some of Domo’s key features.
Real-time Data Analysis
One of Domo’s standout features is its real-time data analysis capability. Imagine you’re in a meeting, and you need to present the latest sales figures. Instead of scrambling through outdated reports, Domo allows you to pull up the most current data instantly.
With Domo, you can connect to various data sources and have them updated automatically. This ensures that your team is always working with the latest information. No more waiting for end-of-month reports—everything you need is at your fingertips.
This real-time analysis can be a game-changer for businesses. When I first used Domo, I was amazed at how quickly I could identify trends and make decisions on the fly. It’s like having a live pulse on your business operations.
Collaboration Features
Another strong suit of Domo is its collaboration features. Have you ever struggled to get everyone on the same page during a project? Domo makes it easy to share insights, dashboards, and reports with your team.
You can annotate data points, leave comments, and even create discussion threads. This makes it easy to gather input from various stakeholders and ensure everyone understands the data. No more endless email chains or confusing spreadsheets.
I remember a project where our team had to analyze customer feedback. With Domo, we created a shared dashboard, and each team member could add their observations. The collaboration was seamless, and we were able to make informed decisions much faster.
Domo’s collaboration tools can improve your team’s efficiency and ensure that everyone is aligned. Have you ever tried collaborating on a project and felt like you were in different time zones? Domo bridges that gap and brings everyone together in one platform.
If you’re looking for a business intelligence tool that offers real-time data analysis and robust collaboration features, Domo is definitely worth considering. What would real-time insights and better team collaboration mean for your business?
Comparing The Tools
Choosing the right business intelligence (BI) tool can be challenging. Many options exist, each with unique features. To aid your decision, we will compare top BI tools. We focus on performance metrics and user experience.
Performance Metrics
Performance metrics are crucial for evaluating BI tools. They show how well a tool processes data. Speed, accuracy, and efficiency are key metrics. Fast tools save time. Accurate tools provide reliable insights. Efficient tools handle large data sets without lag.
Tableau, for instance, excels in speed. It processes large data sets quickly. Power BI is known for its accuracy. It integrates well with Microsoft products. Qlik Sense offers high efficiency. It can handle complex data without slowing down.
User Experience
User experience impacts the ease of use. A user-friendly tool can boost productivity. Intuitive interfaces and easy navigation are vital. Look for tools that simplify data visualization. Clear dashboards help users understand data.
Tableau offers an intuitive drag-and-drop interface. Power BI provides a familiar environment for Microsoft users. Qlik Sense features a smart search function. It helps users find data quickly. Each tool offers a unique user experience.
Choosing The Right Tool
Choosing the right business intelligence tool can be a game-changer for your company’s data-driven decision-making process. With numerous options available, it’s crucial to select a tool that aligns with your specific needs and goals. Here’s how you can make an informed choice.
Factors To Consider
When evaluating BI tools, consider the ease of use. A user-friendly interface can significantly reduce the learning curve for your team.
Compatibility with existing systems is another key factor. Ensure the tool integrates seamlessly with your current software to avoid disruptions.
Scalability is essential for growing businesses. Choose a tool that can handle increasing data volumes and user demands over time.
Cost is always a consideration. Assess whether the pricing model fits within your budget and offers good value for the features provided.
Final Thoughts
Making the right choice involves careful analysis of your business needs and the tool’s capabilities.
Don’t shy away from seeking feedback from other users or testing a demo version to get a firsthand experience.
Remember, the right BI tool can empower your team to make smarter, data-driven decisions. What factors matter most to you when choosing a BI tool?

Credit: www.facebook.com
Credit: www.jazzhr.com
Frequently Asked Questions
What Tools Are Used For Data Driven Decision-making?
Popular tools for data-driven decision-making include Google Analytics, Microsoft Power BI, Tableau, IBM Watson, and SAP Analytics Cloud. These tools help analyze and visualize data for better business insights.
What Is The Most Popular Business Intelligence Tool?
Tableau is the most popular business intelligence tool. It offers powerful data visualization and easy-to-use features. Ideal for analyzing and sharing insights.
Which Business Intelligence Tools Are You Most Interested In?
I am most interested in Power BI, Tableau, and Looker. These tools offer robust analytics and visualization capabilities.
How Business Intelligence Tools Can Contribute To Effective Decision-making?
Business intelligence tools analyze data, providing insights for informed decisions. They identify trends, improve efficiency, and reduce risks.
Conclusion
Choosing the right business intelligence tool is crucial. It helps make informed decisions. Each tool offers unique features. Evaluate them based on your needs. Consider ease of use and integration capabilities. Look at the pricing and support options. Make a list of priorities.
Test a few tools before finalizing. Good business intelligence tools can drive success. They provide valuable insights. They help in making smart decisions. Invest wisely in the best tool. Your business will benefit greatly.